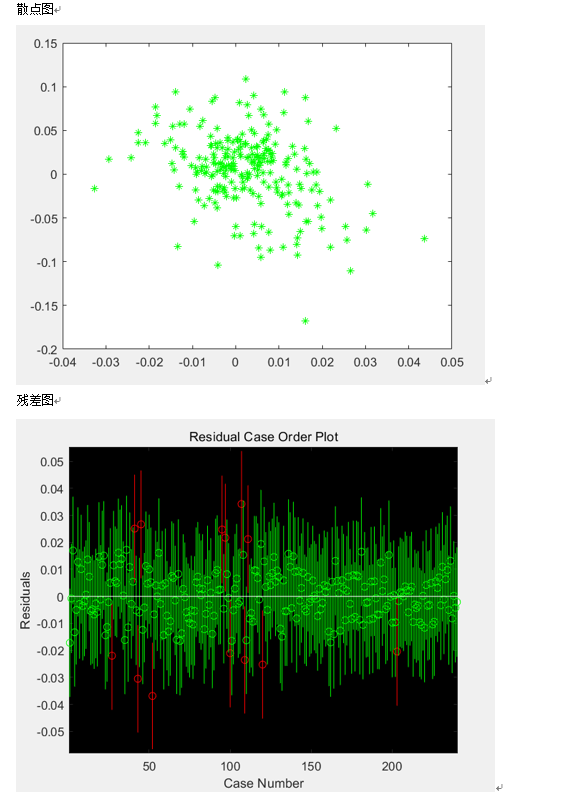
DATA analysis of market excess return and portfolio excess return from WRDS (Wharton research data services)
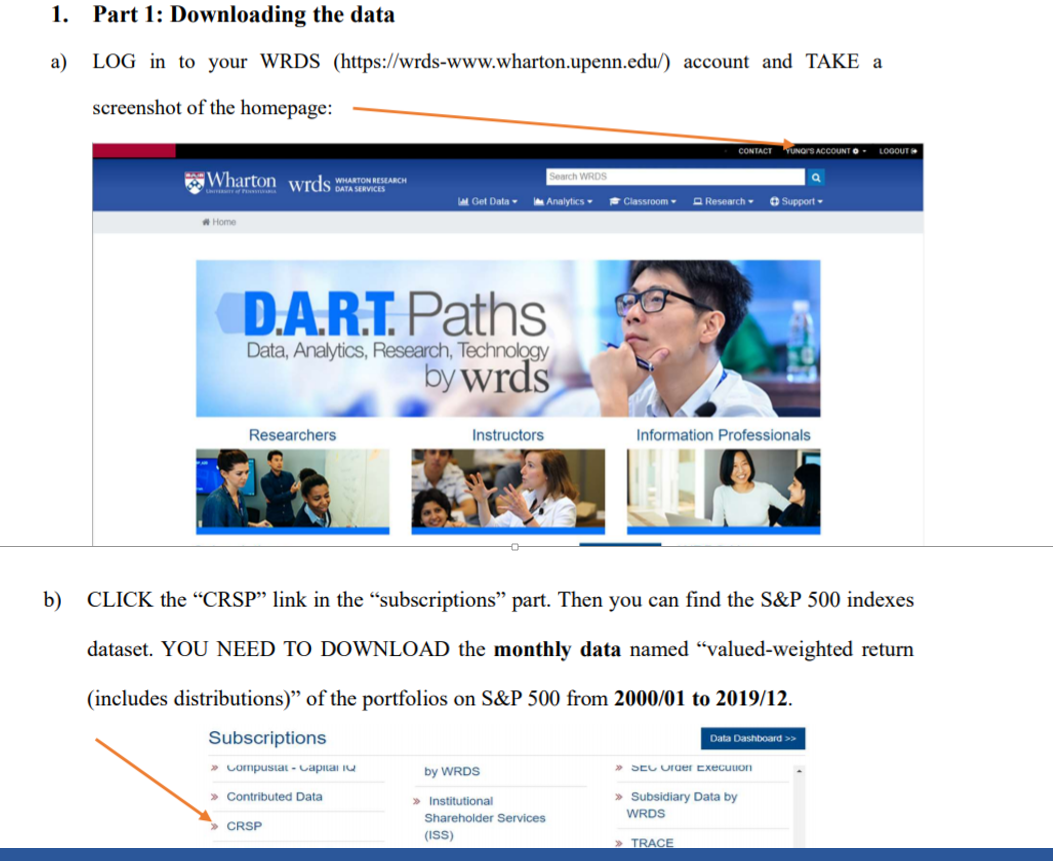
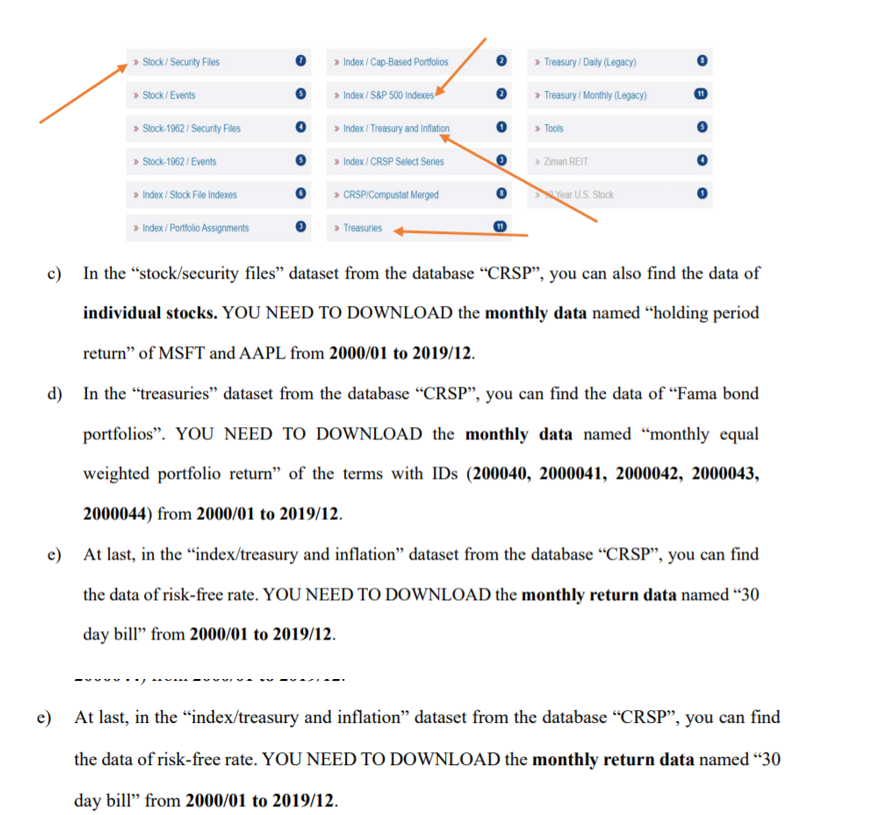
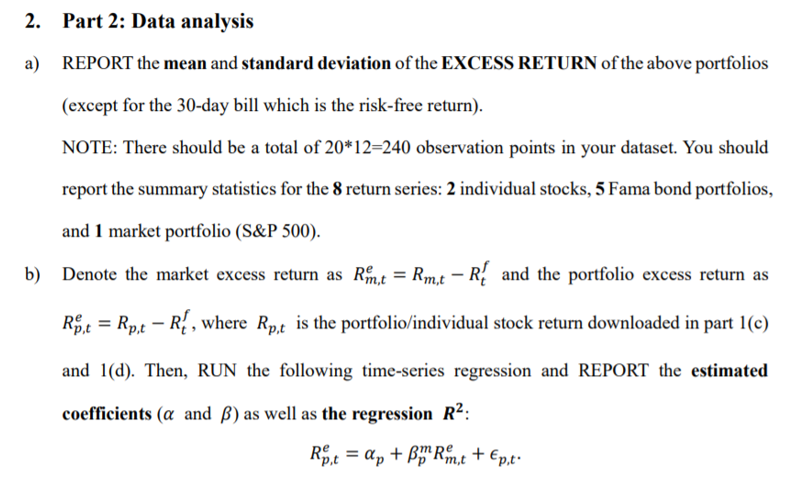
Actual matlab calculation results:
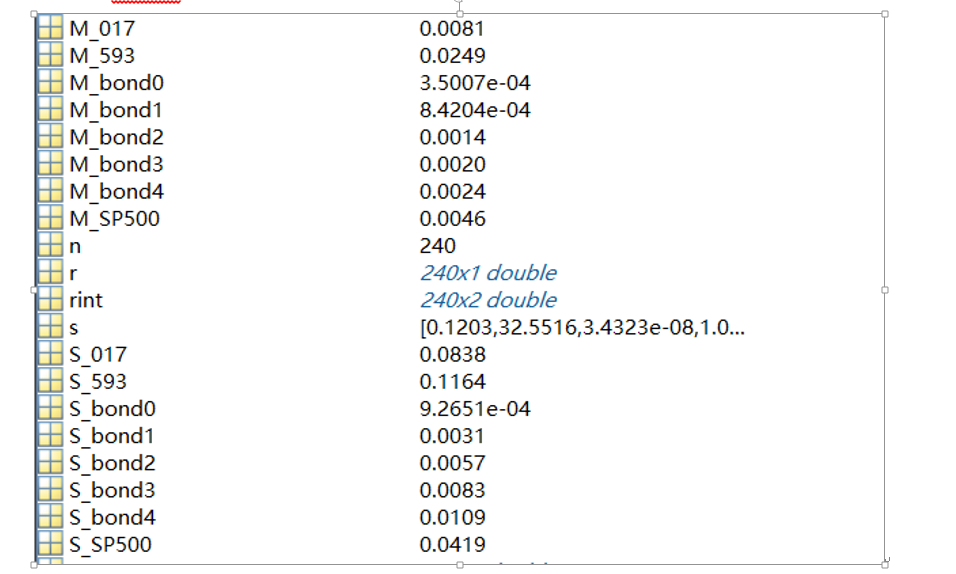
estimated coefficients (𝛼 and 𝛽) as well as the regression 𝑹^2 are below
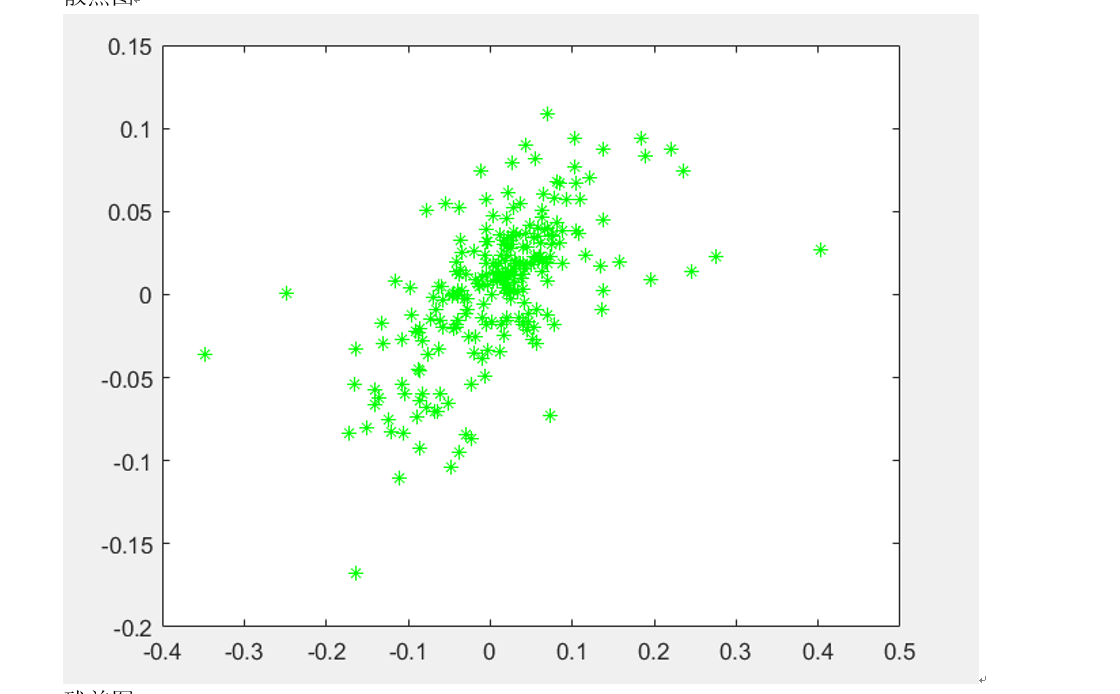
MSFT 𝛼 : 0.0026 𝛽 : 1.2075 𝑹^2 : 0.3652
Scatter plot
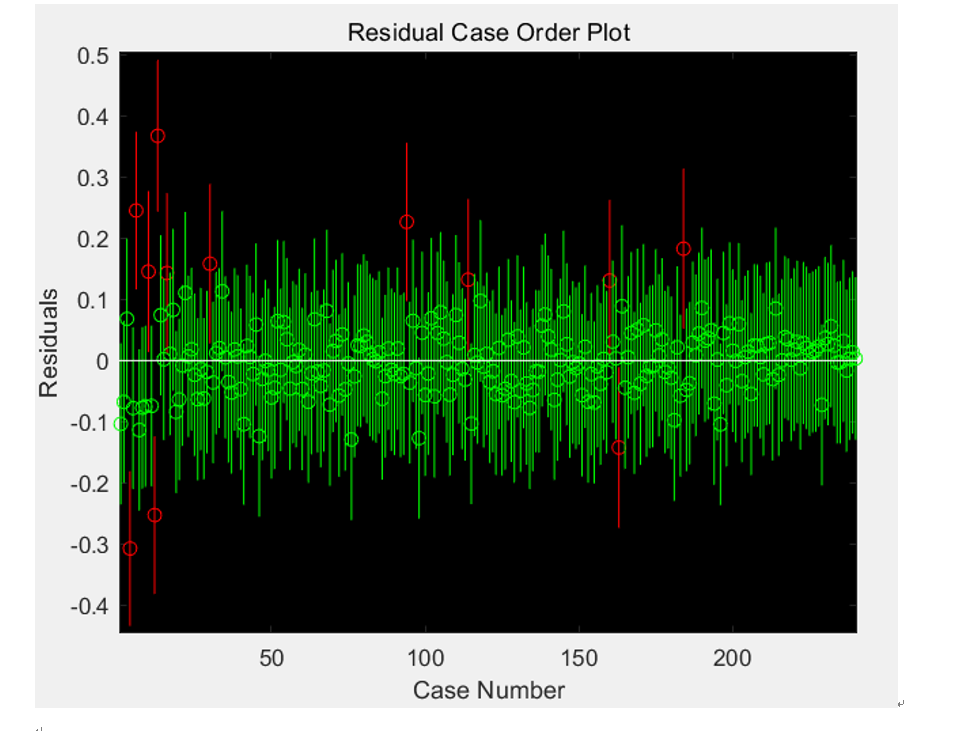
Residual plot
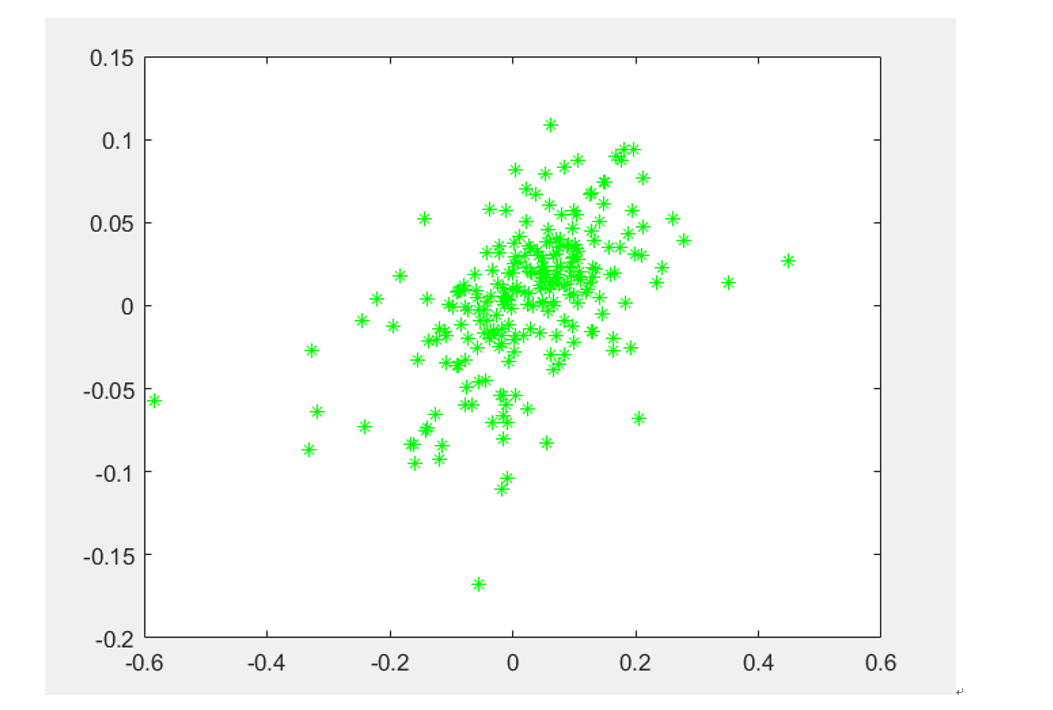
AAPL 𝛼 : 0.0185 𝛽 : 1.4130 𝑹^2 : 0.2592
Scatter plot
Residual plot
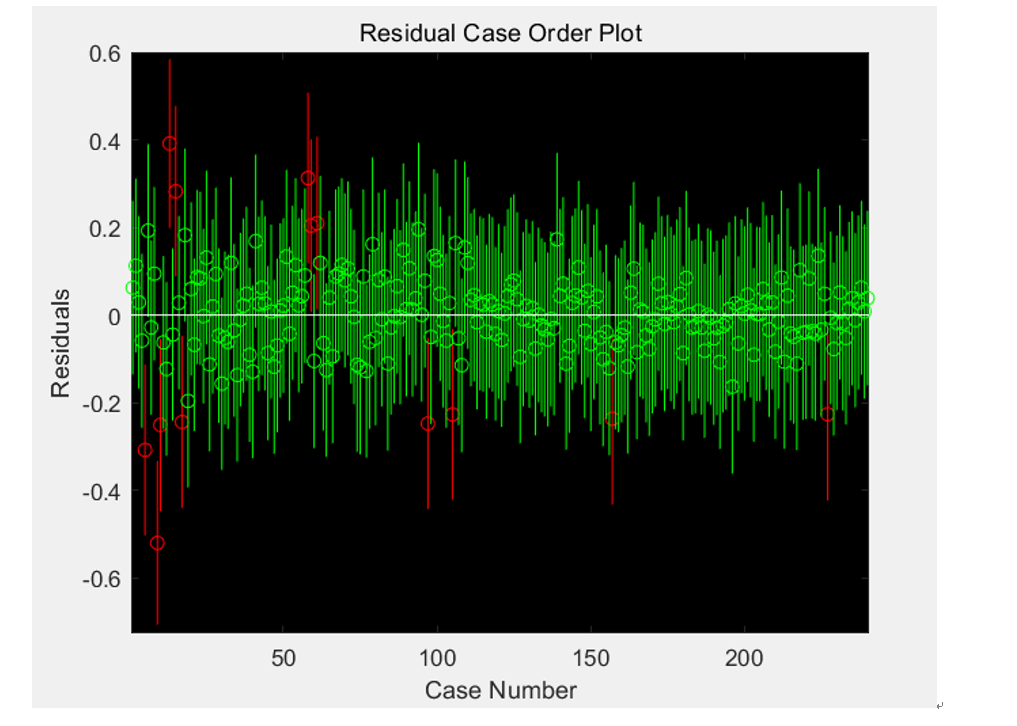
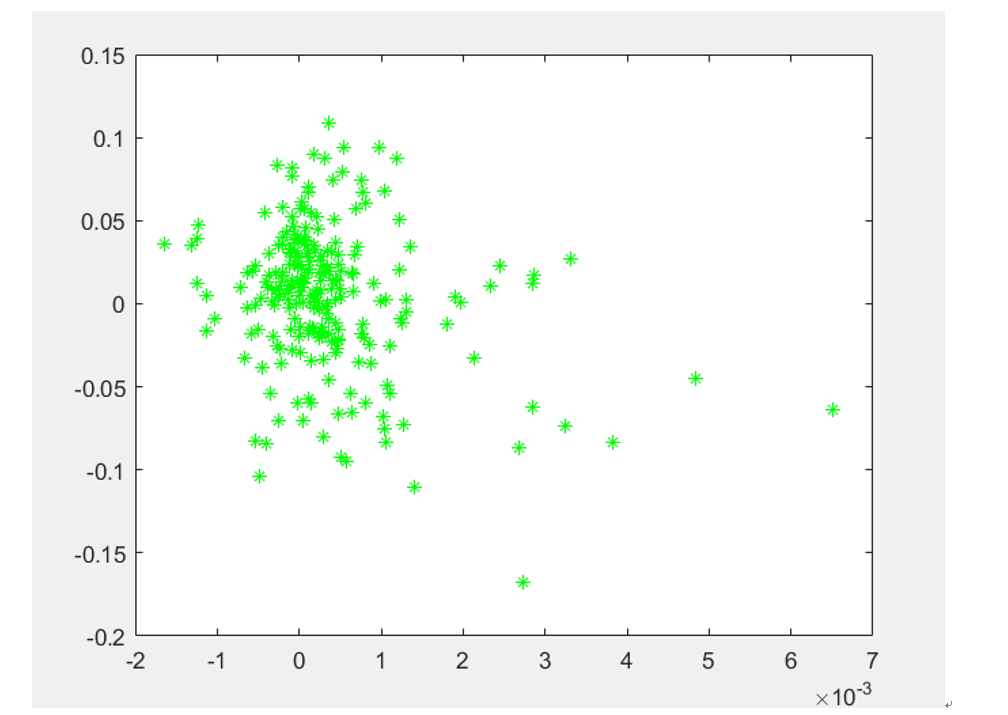
200040 𝛼 : 0.0004 𝛽 : -0.0059 𝑹^2 : 0.0725
Scatter plot
Residual plot
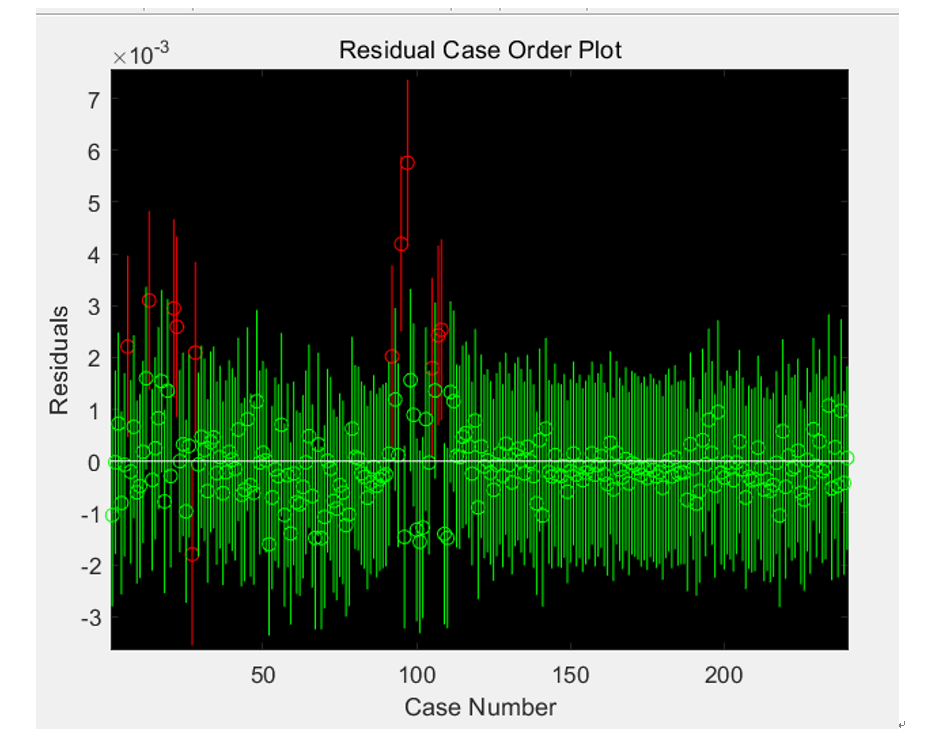
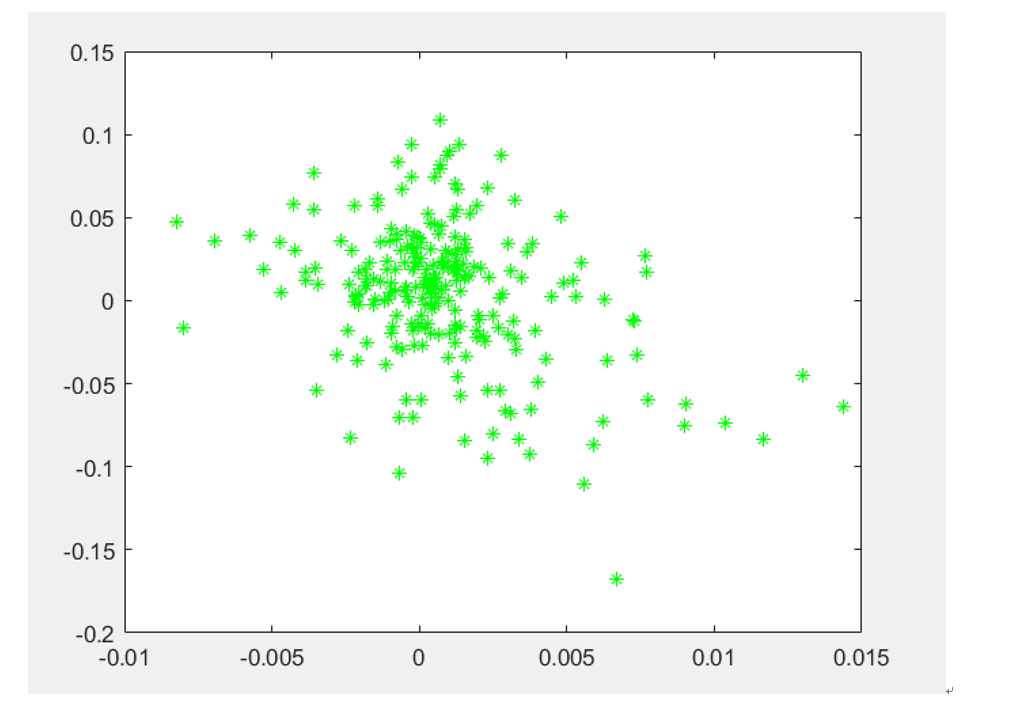
200041 𝛼 : 0.0010 𝛽 : -0.0265 𝑹^2 : 0.1294
Scatter plot
Residual plot
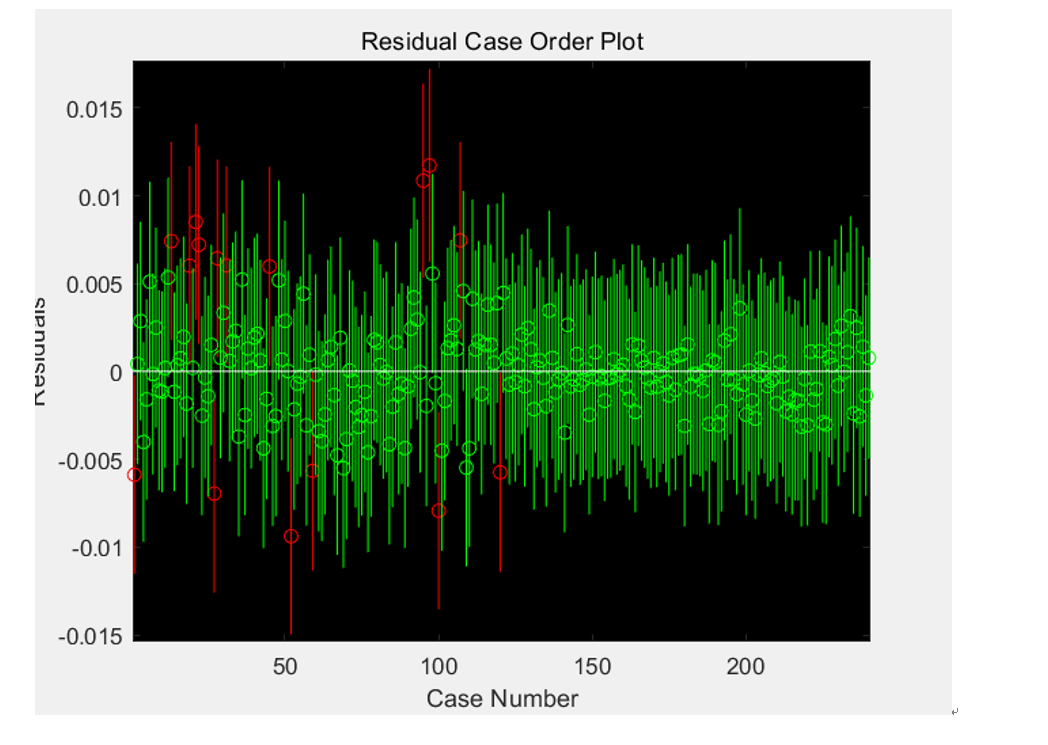
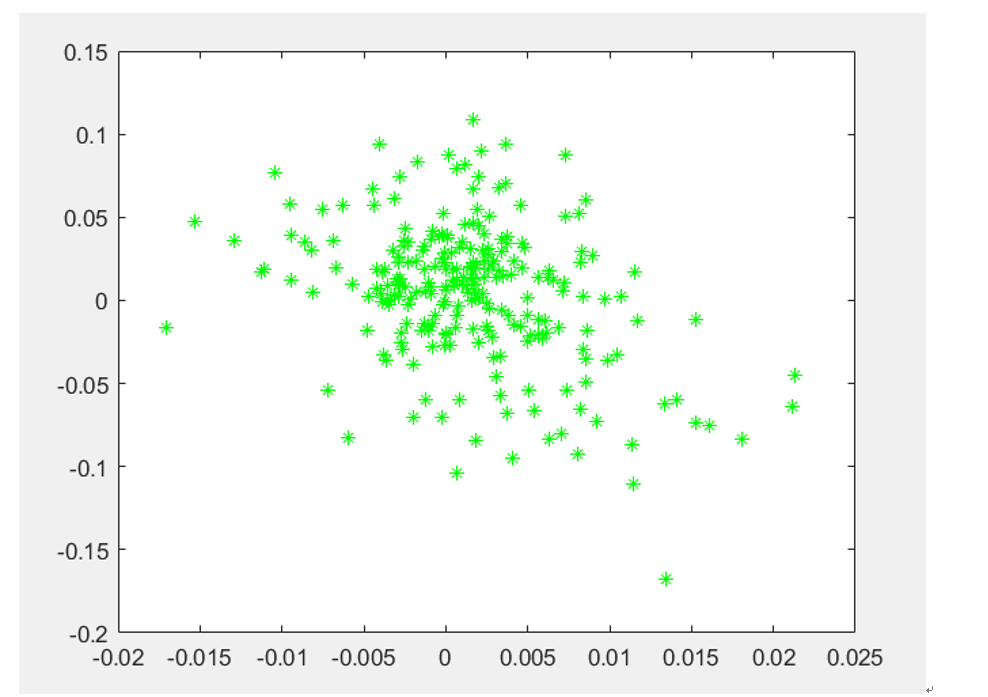
200042 𝛼 : 0.0017 𝛽 : -0.0499 𝑹^2 : 0.1361
Scatter plot
Residual plot
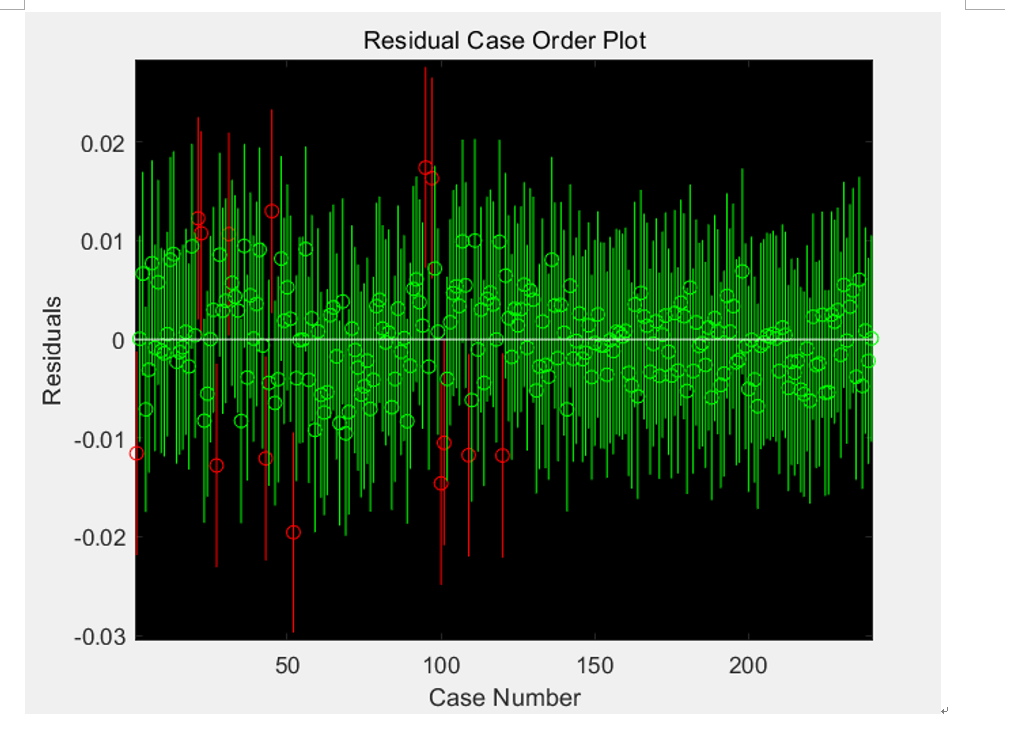
200043 𝛼 : 0.0023 𝛽 : -0.0704 𝑹^2 : 0.1269
Scatter plot
Residual plot
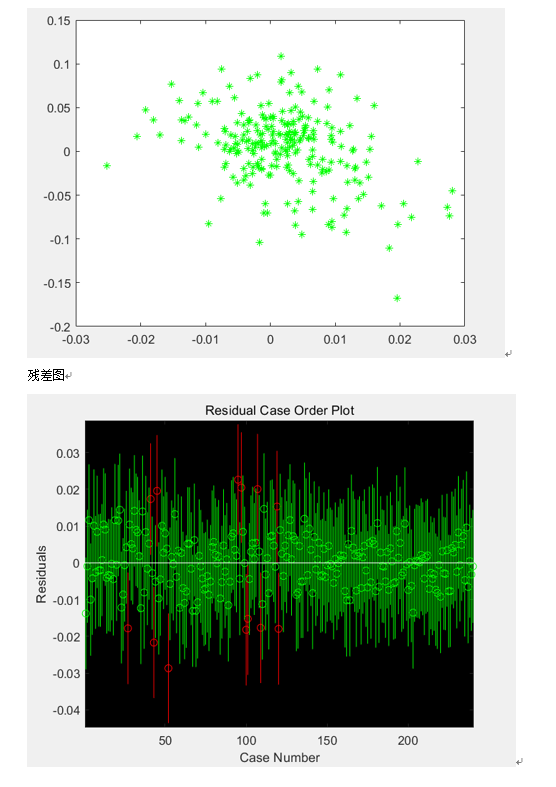
200044: 𝛼 : 0.0028 𝛽 : -0.0900 𝑹^2 : 0.1203
Scatter plot
Residual plot